You may have saw our article on how to enable IOS DEBUG logging and realized after enabling it that the log gets spammed quite a bit which may actually make it harder to isolate an issue, especially if other users are currently in the system.

Today we will show you how to turn on DEBUG logging for a specific user to minimize log spam. This tutorial is only for the ios_logging.xml log.


  1. Login to your on-prem LSF system (admin rights required)
  2. Identify the users RM ID (case-sensitive) that you want enable debug logging for.
  3. Locate and backup your ios_logging.xml file in %LAWDIR%\system
  4. Edit ios_loggin.xml with a text editor
  5. Locate the following section:


<root>
<priority value=”INFO” />
<appender-ref ref=”IOS” />

<!– Appender Filters–>
<!–<appender-ref ref=”PORTAL” /> –>
<!–<appender-ref ref=”DIRECTIOS” /> –>

</root>


Change INFO to DEBUG:

<root>
<priority value=”DEBUG” />
<appender-ref ref=”IOS” />

<!– Appender Filters–>
<!–<appender-ref ref=”PORTAL” /> –>
<!–<appender-ref ref=”DIRECTIOS” /> –>

</root>

  1. Locate the following section:

<!– Filter for users  –>
  <!–
<filter class=”com.lawson.ios.util.log.Log4JMDCFilter”>
<param name=”keyToMatch” value=”username” />
<param name=”valueToMatch” value=”lawson” />
<param name=”denyOnMatch” value=”false” />
</filter>
<filter class=”org.apache.log4j.varia.DenyAllFilter”/>
–>

Uncomment this section (remove the <!– and –> characters shown in bold above) and edit the “valueToMatch” value=”lawson” replacing “lawson” with the RM Id of your user, like so:

        <!– Filter for users  –>

<filter class=”com.lawson.ios.util.log.Log4JMDCFilter”>
<param name=”keyToMatch” value=”username” />
<param name=”valueToMatch” value=”ENTER_USERNAME” />

            <param name=”denyOnMatch” value=”false” />
</filter>
<filter class=”org.apache.log4j.varia.DenyAllFilter”/>

  1. Save your changes (no restart required and you should see immediate changes)
  2. You should now see DEBUG entries in the log for that specific user.
  3. Just undo step 6 to revert changes (or revert to your backup file).

Good luck and happy debugging!

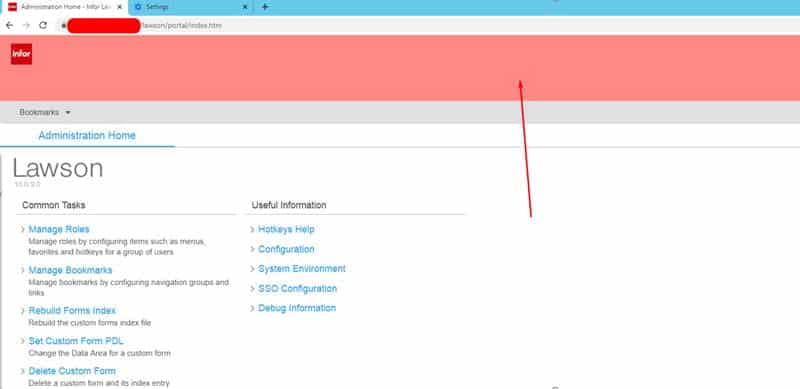
When having users test new patches, it’s a good practice to distinguish TEST from PROD visually. This helps users know what environment they’re in as they may be testing after a long day and may think they are testing in TEST when in fact they are changing production data.


This can simply be done by changing a banner color in Lawson Portal.

  1. Login to your TEST environment and locate your index.htm file found here: “D:\<lsf_folder>\web\lawson\portal”
  2. Assuming your index.htm file is unmodified locate header id=“topBanner”

  3. Use an online HTML Color Picker tool to choose the hex color you want to appear and replace background-color:#ff8787 to your preferred color hex color code.

Example of how it will appear:

  1. Save the changes, clear IOS cache, clear your browser cache, logout and back in to see the change. Enjoy!

In LBI Auditing Part 3b we went over Reporting Service Admin Audit Reports. In this article we will go over the Service Now (SN) portion of reports.


SN01.List of Alerts:

This report allows you to view what user(s) and or group(s) have access to what SN alert/report.

Column Name Description
Alert ID Assigned alert ID number.
Alert Name Alert name created by owner.
Owner Owner who published alert.
Creation Date Date in which the alert was created.
Last Modified/Rendered Date when the alert was last modified.
Shared To Alert shared access.
Roles Roles that grant access to the alert.
Security Specify Type of access (public, user, or group).


SN02. User/Group Access on SN Alerts:

This is a security report showing user/group access to specific alerts.

Column Name Description
User/Group Name of user or group.
Specify Access type (user or group).
Roles Roles that grant access to the alert.
Alert ID Assigned alert ID number.
Last Modified/Rendered Date when the alert was last modified.
Alert Alert name created by owner.
Last Rendered Date when the alert was last modified.


SN03.Top Rendered Alerts and their Top Viewers:

This report shows statistics on your most viewed alerts and top viewers.

Column Name Description
Top Alert Alerts with most views starting at the top
Alert Name Alert name created by owner.
No. of Views Total number of alert views.
Alert ID Assigned alert ID number.
Group Group being notified
Owner Owner who published alert.
Rank Top ranked viewers of the specific alert.
Viewer User viewing report.
Roles Roles that grant access to the alert.
User Views Total number of views per user.


For more details on these admin audit reports, check out Part 3a “Overview of Framework Service Admin Audit Reports” and Part 3b “Overview of Reporting Service Admin Audit Reports”.

In LBI Auditing Part 3a we went over Framework Service Admin Audit Reports. In this article we will go over the Reporting Service (RS) portion of reports.


RS01.RS Reports:

This report shows all your reports in LBI along with the below details.

Column Name Description
Report ID Assigned ID when report was created.
Report Name Report Name (may differ from given dashboard name).
Owner Owner who published report.
User User access to the report.
Date Created Report creation date.


RS02. User Access on Reports:

This is a security report showing user/group access to specific reports.

Column Name Description
User User with LBI access.
Report ID Assigned ID when report was created.
Report Name Report Name (may differ from given dashboard name).


RS03.Top Viewed Reports in RS:

This report shows statistics on your most viewed reports, what users viewing them the most and total views per user.

Column Name Description
Report ID Assigned ID when report was created.
Report Name Report Name (may differ from given dashboard name).
Access Viewer Top Viewer of a specific report
Number of Views Total number of views by a specific user


RS04.Top Scheduled/Exported Reports

This report shows statistics on your most scheduled and exported reports.

Column Name Description
Report ID Assigned ID when report was created.
Report Name Report Name (may differ from given dashboard name).
Frequency Total number of time a report has been scheduled/exported.


For more details on these admin audit reports, check out Part 3c “Overview of Service Now Admin Audit Reports” (coming soon) and/or Part 3a “Overview of Reporting Service Admin Audit Reports”.


In LBI Auditing Part 2, we went over setting up admin audit reports in LBI. In this article we will go over the Framework Service (FS) portion of reports.


FS01.FS Content:

This report may contain a lot of data and can take longer to generate. It displays dashboard, module, and content links. Couple with this type of data, you will be able to see user ownership, security type, shared/view access, create and modified date data.


Column Name Description
Dashboard-Module-Links Created content name, shared/not shared.
Item Specify Type of content (Dashboard, Module, Link).
Owner Owner of content
Shared to User or groups that have access, specific sharing rights.
Security Specify Shows whether shared access is public, from a user, or group.
View Access Viewing rights from users or groups (design rights or not).
Modified Date Last logged date the content has been changed/modified.
Creation Date Date in which the content was created.


FS02.User/Group Access on FS Content:

This report shows what content a user or group has access to.

Column Name Description
ID The ENPTREEENTRYID where the user belongs to.
User/Group User/Group Name and their access to certain content.
Security Specify Access Type: public, user, or group.
Access Items Content each user has access to.
Item Specify Type of content (Dashboard, Module, Link).
Creation Date Date in which the content was created.


FS03.Top Viewed Links in Framework Services:

Links that are captured and logged in the database if the Auditing feature is turned on. (See LBI Auditing Part 1 of how to set this up.)

Column Name Description
Names Names of the FS Links.
Access View User access.
Access Value Access level to a certain user or group (if public at all).
Views Count How many times a link was viewed


For more details on these admin audit reports, check out Part 3b “Overview of Reporting Service Admin Audit Reports” and Part 3c “Overview of Service Now Admin Audit Reports” (coming soon).

In LBI Auditing Part 1, we went over enabling dashboard auditing. This time we will go over how to set up special Admin Audit Reports to view more information about LBI activity via Framework/Reporting Services and Smart Notifications. These reports are for 10.6.0.0 and later but check with Infor if they are supported for older versions.


  1. Login to Infor Support Portal and go to the LBI Product Download page.
  2. Download the BI-Samples.zip file and unzip to a temporary location
  3. Locate Infor-LBI-Admin-Reports-SolutionPack.zip
  4. Login into LBI and go to Tools dashboard
  5. Click the Deployment Utility link and a Deployment Utility window will pop-up
  6. Browse for the solution pack mentioned in Step 3, select it and then click Import
    • NOTE: Framework Services content is delivered in a folder called fs; Reporting Services in a folder called rs; Smart Notification in a folder called sn.
    • No tab will be displayed for a service if the solution package does not contain a solution for that service or if the service is not registered/installed.
  7. When the import is completed, a screen is displayed with a tab for each imported package, click on a tab to view the import and additional details.
  8. If the import fails for any reason, try and correct the issue, verify zip file is not corrupt, re-import.
    • NOTE: Remove any applications directories where the import was successful to avoid duplicate content.


Make sure to check out Part 3a – “Overview of Framework Service Admin Audit Reports”  (coming soon) to get more insight into these reports.