

Contract management is crucial for risk minimization, optimization and value creation, but in 2015 the NAO identified systematic weaknesses in both government and commercial sectors. The NAO’s 2015 Transforming Government Contract Management report notes that much remains to be done, including far-reaching changes in the culture of the public service and its ability to procure and manage commercial contracts. The report was triggered by the high-profile overbooking of the Ministry of Justice’s 10-year electronic surveillance contracts with G4S and Serco. Four years later, it is now recognized that effective contract management has been achieved in the commercial departments. However, the 2015 report found “systematic weaknesses” in government and commercial contract management in the day-to-day management of contracts. [Sources: 7]
In most government departments, contract management activities are scattered throughout the organization, involving many different people in different roles at different distances from the front. This makes a lot of sense, because the management of contracts is most effective when it takes place close to the goods and services supplied. Allegations of ineffective contract management for the public purse are most frequently cited, but the truth is that effective contract management applies equally to the private sector. Effective contract management is more than managing the specific words and clauses on paper. In reality, it is much more comprehensive: it covers all aspects of the value and risk arising from contracts. [Sources: 5]
The same applies to public institutions. As you can see, the public sector has many of the same forces that influence it as the private sector. There is therefore an increasing need for more and better contract management. Public sector bodies need to rely more on processes that control and manage internal costs. This means that challenges are being raised and there is a greater need for technology and process transformation to outsource a wide range of areas, including contract and commercial management. [Sources: 8]
It is not enough for organizations to have contract management specialists. Employees must be supplemented by process and software support in order to meet the increased compliance requirements and analytical requirements. The expected economic benefits and financial returns must be realized. [Sources: 1]
The basis of contract management is based on the implementation of successful upstream activities after the award. Further consideration will have to be given before the contract is awarded. In the pre-award phase, employees focus on the reasons for concluding the contract with the supplier and fulfilling the contractual conditions. [Sources: 1]
At a time when public authorities need to be diligent about how public dollars are spent, it is imperative that contracts with this aim be developed in mind before the process of managing contracts is completed. The contract should specify exactly what is expected of the contractor. [Sources: 4]
Furthermore, contracts should allow public sector parties to carry out audits of their quality management and management information systems to ensure that the contract remains sustainable. Public sector parties will also have to deal with the requirements of the Official Information Act 1982 as applied to them, including the types of access granted to them by internal and external auditors. They also need to have financial information to convince themselves of the continued financial viability of the public sector. [Sources: 2]
Disputes should be resolved as quickly as possible at the appropriate level of dispute settlement procedures, thereby promoting negotiation and mediation between the parties. There should be an agreed mechanism whereby the parties are mutually informed of the problems arising from the Treaty. [Sources: 2]
Often the only viable option is to settle the dispute in court. Costly litigation drives up the cost of providing services to public bodies, even if the agency wins, and that is because the agencies prepare for litigation by using staff time and agency resources. [Sources: 4]
Public procurement and contract management officials exacerbate the problem by building a cocoon around their offices, pretending that their offices “goals, tactics, and actions are independent of the company’s goals. Others create resentment by acting as policemen and enablers. They are unable or unwilling to push for strategic public procurement or contract management. Failure to plan procurement, define requirements, award and manage contracts costs public institutions dollars and opportunities in the short and long term. [Sources: 6]
We still have a long way to go before contract management gets the recognition it deserves. Understanding the challenges of contract management is an important step towards improving the situation. Addressing these challenges requires efforts by all public sector organizations. What matters is improving growth, and the International Association for Contract and Trade Management (IACCM) is a sign of this. Where it has gone wrong, it is clear how important it is for organizations to do better. [Sources: 0]
Given that we are in an interesting double Brexit storm and a second Covid wave, it is vital to understand its position as a single entity of government. It requires at least some basic forms of digitalization, spending analysis, and supplier contract management, so that suppliers can trust the government to weather the storms around them. It also requires transparency in the way money is spent. We believe that the next period will provide opportunities for public sector organizations to operate from one position: they are the customers of choice and can rely on them to accelerate cash flow to companies in difficult times. [Sources: 3]
Sources:
[0]: https://www.publicspendforum.net/blogs/peter-smith/2017/03/20/contract-management-europe-challenge-public-sector-procurement/
[1]: https://www.businessnewsdaily.com/4813-contract-management.html
[2]: https://oag.parliament.nz/2006/public-private/part4.htm
[3]: https://spendmatters.com/uk/why-supplier-and-contract-management-are-the-hot-topics-for-government-cpos-and-ccos-right-now/
[4]: https://www.bakertilly.com/insights/developing-effective-contracts-for-the-public-sector
[5]: https://www.proximagroup.com/why-contract-management-is-so-difficult-to-get-right-in-public-sector/
[6]: https://patimes.org/improving-procurement-contract-management-government/
[7]: https://www.civilserviceworld.com/articles/partner_article/proxima/why-contract-management-so-difficult-get-right-public-sector
[8]: https://www.capgemini.com/2015/09/contract-management-3-reasons-why-the-public-sector-is-looking-for/

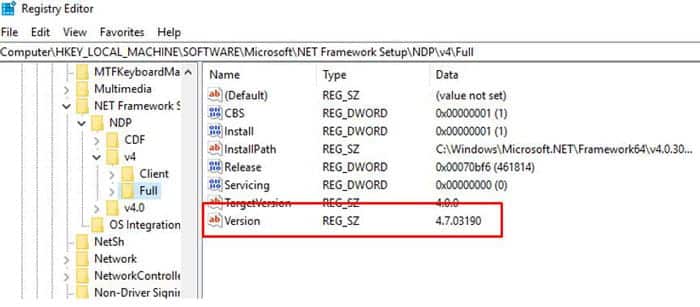
Many Infor installs require a specific version for .NET Framework. The framework version is no longer displayed in the Installed Programs list. The easiest way to find the exact version is to open the registry editor (press Start and search for “regedit”). Navigate to HKEY_LOCAL_MACHINE > SOFTWARE > Microsoft > NET Framework Setup > NDP > v4 > Full
The installed version is listed under the “Version” string value

Against this background, rewards should function as expectation. Thinking through the worst-case scenario is important, but provided the supplier exceeds your expectations, he should be rewarded for what he has done. This can be an instant payment or a simple thank you. [Sources: 0]
Both the customer and the supplier are responsible for the success or failure of the working relationship. Take responsibility for your place in the process and acknowledge that your decisions about delays, timing or changes in project scope can affect the ability of suppliers to do their job. Maintain your sanity and the sanity of your office manager. [Sources: 0]
By sharing the results of this analysis with your suppliers, you can develop a more accurate sales plan and work on a common sales forecast and planning. The use of an ordering system to control and monitor the purchase of goods and services from suppliers can be used to facilitate internal financial control and to avoid specification misunderstandings with suppliers in the end. You should also have a payment policy that requires your company to pay undisputed invoices on time, with copies sent to your suppliers. This puts a strain on your relationship with suppliers, but can also lead to more favorable conditions in the future. See our Guide to Storage and Control of Stock. [Sources: 9]
When you talk to purchasers and quality teams, one of their main obstacles to good supplier management is supplier information management – the constant maintenance of information. Make sure that the platform you choose allows providers to update their own information systems so that it is easy for them to do so. In this way, they are responsible for maintaining up-to-date information, which is important for all suppliers. For example, set notifications and reminders for vendors whose certificates have expired so they can make a new copy, rather than having to chase them. [Sources: 4]
The supplier management process does not end when you have chosen a supplier. After selecting and entering, you will need to evaluate their performance to see if they meet a range of objectives and requirements. To ensure a practical evaluation, make sure you create KPIs to measure performance. [Sources: 3]
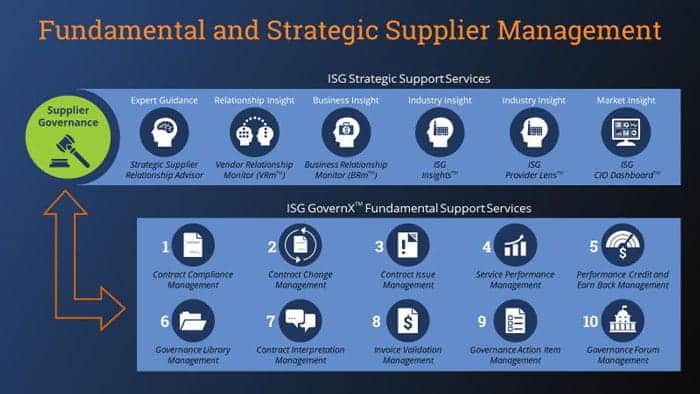
The following chart shows the basic strategic levels that are necessary to effectively manage suppliers. The execution of basic activities in connection with complex supplier relationships is computationally intensive and expensive. When a company merges data from daily supplier management with data from the broader industry, the company, its vendors and the market, it draws a detailed picture of the source relationships and their potential for improvement. [Sources: 1]
The responsibility for supplier relationship management lies solely with the procurement team. Strategies for managing supplier relationships are craftsmanship and can never be achieved without involving internal stakeholders. One villain can bring down the entire process. [Sources: 5]
Here are five ways to improve strategic supplier relationships. One of the most overlooked aspects of strategic supplier relationship management is how suppliers are viewed by the purchasing organization. When an SRM considers the entire supply base, strategic suppliers are seen as part of the whole. [Sources: 8]
Strategic suppliers, be it strategic issues or cross-functional concerns. Therefore, buyers should be careful to bring their stakeholders together and involve them in the management of the partnership. Companies should invite relevant employees to supplier meetings to discuss performance and future opportunities. [Sources: 8]
GM should have a formal system for suppliers to provide it with feedback. Assessment procedures should not be a one-way street. GM cannot be expected to build trust without listening to its suppliers. What we need is to pool resources for joint projects and reassure suppliers that GM is committed to their success. [Sources: 2]
Be sure to maintain strong and regular communication with your suppliers. If something doesn’t work for you, let them know. Keep them informed of your strategy and plans so they know where they fit in, how they can help with the plan, and who benefits. If you appreciate their work, let your suppliers know. [Sources: 7]
Your suppliers play a big role in your retail business, so don’t neglect them. Strive to find the best providers in your industry, and once you have an agreement, maintain a healthy relationship through communication, professionalism, and good old-fashioned kindness. [Sources: 6]
Procurement officials need to research carefully to maintain beneficial relationships with suppliers, not counterproductive showdowns. Poor quality can be expensive, so procurement officials should be more careful in selecting suppliers and learn more about the suppliers they want to know. [Sources: 2]
Globalization has torn today’s businesses apart and made business processes more dynamic, competitive and complex than ever before. Organizations engage suppliers to provide various goods and services to maximize business performance. Suppliers are an indispensable part of any business and their effective management is crucial. [Sources: 3]
For many organizations, SRM is seen as a tool to manage critical suppliers. In a previous paper, I examined the SRM framework. In researching the entire supply chain, I segmented strategy and supplier initiatives by segment. [Sources: 8]
Expenditure management and visibility: not having SRM on board means missing data and poor visibility of expenditure. If you do not know how much is spent on a seller or what is bought in detail, it is impossible to judge whether you are getting the best service value and it is difficult to compare providers. [Sources: 7]
If you have a Service Level Agreement (SLA), it will help you to assess the relationship between companies and suppliers as objectively as possible. Not all levels are the same, but it is worth using an SLA to define the level of service you require from your suppliers. [Sources: 9]
Sources:
[0]: https://quickbooks.intuit.com/r/products-and-manufacturing/10-tips-to-effectively-manage-vendors-and-suppliers/
[1]: https://isg-one.com/third-party-management/isg-governx-spend-management/articles/top-ten-fundamentals-for-managing-suppliers-a-checklist
[2]: https://hbr.org/1989/07/managing-suppliers-up-to-speed
[3]: https://www.zycus.com/blog/supplier-management/understanding-supplier-management-its-benefits-process-and-best-practices.html
[4]: https://spendmatters.com/2019/10/17/5-easy-steps-to-better-manage-your-suppliers/
[5]: https://kissflow.com/procurement/vendor-management/supplier-relationship-management/
[6]: https://www.vendhq.com/blog/supplier-relationship-management/
[7]: https://planergy.com/blog/improve-supplier-relationship-management/
[8]: https://www.forbes.com/sites/jwebb/2018/03/30/how-to-manage-strategic-suppliers/
[9]: https://www.infoentrepreneurs.org/en/guides/manage-your-suppliers/

You want to work with an IT partner that has functional knowledge in addition to the technological ability to extract and re-map the data. This allows a true partnership that looks at the process from a high level and keeps an eye on the details at the same time.
You need to look for a partner that has experience extracting data from Lawson and mapping to the format needed to upload set up and transactional data to any system and taking extracted data from another system and formatting it into what Lawson needs and uploading the data. A partner who uses a repeatable process that allows for tweaking the process if needed through testing cycles and then having the final version ready when you are ready to go-live.
When considering a divestiture there are many considerations. Some of these are:
How much history needs to remain on the current books?
How much history needs to be extracted for the divested company?
What happens to any un-paid vendor invoices? Will they remain on the current company or move to the divested company?
What kind of training will be needed for the divested or remaining users?
What interfaces need to be addressed? Are there any that need to be moved to the divested company or more importantly changed on the current company to ignore the divested company’s data?
Make sure to start with a BRD – Business Requirement Document – so you have a road map of what is expected throughout the process. This helps you, the divested parties and your partner know what is expected from all parties.
With the right partner, you can have a smooth and successful transition.

Your IT department will be busy during a divestiture.
The obvious part your IT department will play is data extraction for the data that needs to moved (or copied) from the current company to the divested company. All of your interfaces need to be reviewed to determine which of those need to be turned off or adjusted to prevent data from the divested company coming into your system after the divestiture is complete.
When considering a divestiture there are many considerations. Some of these are:
How much history needs to remain on the current books?
How much history needs to be extracted for the divested company?
Coordination between IT departments (current company, divested organization) on current interfaces and how they will be handled in the divested organization.
Make sure to start with a BRD – Business Requirement Document – so you have a road map of what is expected throughout the process. This helps you, the divested parties and your partner know what is expected from all parties.
Sometime you may have a need to update your LDAP bind connection, such as when the domain controller you are bound to is decommissioned.
To update the LDAP bind connection,
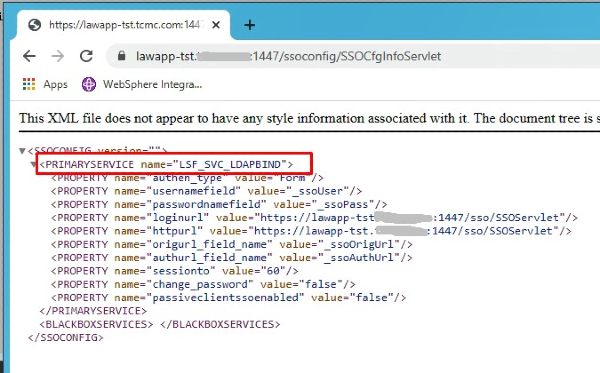
First figure out which service is using ldap bind. To do that, go to http(s)://<server>:<port>/ssoconfig/SSOCfgInfoServlet. Make a note of the service name displayed on the page.
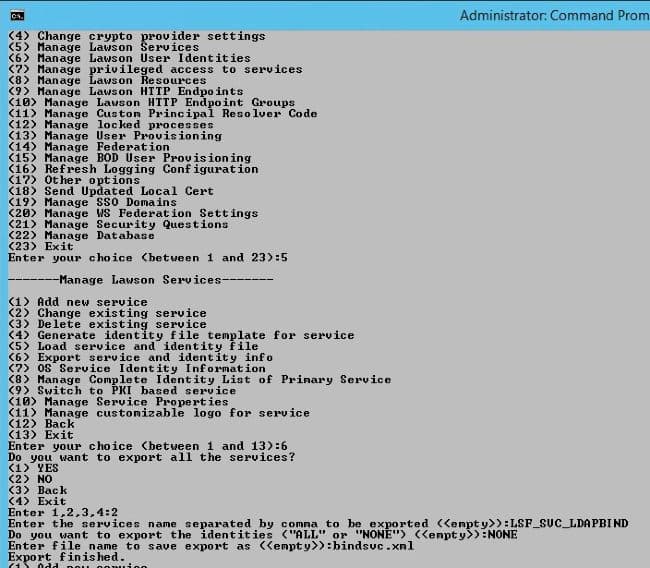
Next, log into ssoconfig and export that service:
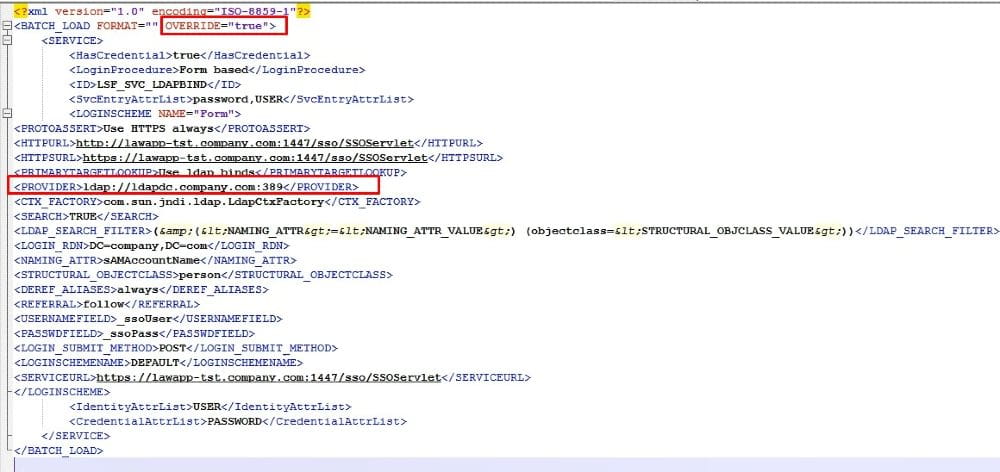
Now, open the file you just exported. Update the OVERRIDE attribute to “true”. Update the “PROVIDER” element to the new server and port.
Next, upload your updated file into ssoconfig. The syntax is ssoconfig -l <password> <full file path>
For example:

Ssoconfig data is stored in the security cache, so you will need to recycle your system for this change to take effect.
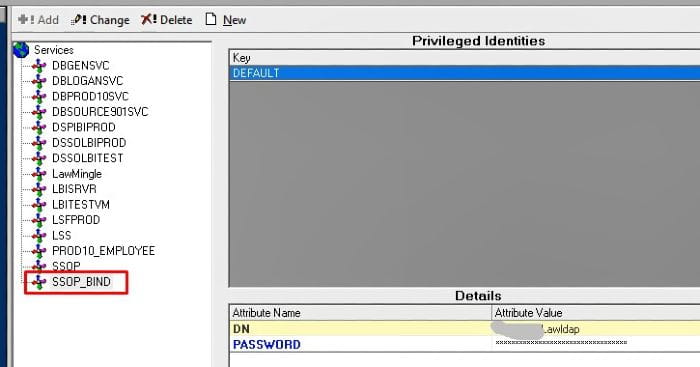
NOTE: If you need to change the credentials for the domain controller, this will be an extra process. You will need to update the service associated with your LDAP bind. This is most likely your SSOP_BIND service. You can look under privileged identities in Lawson Security, check for a “DEFAULT” key associated with your ldap bind user. That is your LDAP bind service.
To update the credentials for this service, log into ssoconfig and select Manage privileged access to services > Change existing identity. Enter the service that you noted above. Enter the correct user DN. Enter the password.

Recycle Lawson.