How to tune the performance of a Lawson 4GL program
Lawson programs, especially batch jobs, can sometimes take hours to complete. In rare instances, a badly written 4GL batch job can even take days to complete depending on the number of records it has to process and how it goes about doing so. Depending on your skill set, you may be able to optimize the code directly and use a debugger to find out how to speed things up. But if you want some statistics about what the program is doing and a quick shortcut, then there’s a utility for that.
The utility is actually several different utilities wrapped into one.
dbadmin utility to set some parameters. The main parameter you want to set is the TIMESTATS parameter. The timestats function is activated using the dbadmin utility.
Before you go changing stuff, to show current settings, run ‘dbadmin get’ from a LID command prompt or a qsh command prompt in System i.
#Example:
dbadmin get
Current Value for REUSE=ON
Current Value for DEBUG=OFF
Current Value for DBAPIERRORS=ON
Current Value for TIMESTATS=OFF
Current Value for USERFILTER=
Current Value for PROGRAMFILTER=
Current Value for DATAREAFILTER=
Current Value for TIMESTATSDIR=/tmp
Current Value for IDLETIME=1
Save this off for future reference.
#To enable timestats, run the following commands:
dbadmin set timestats on
dbadmin set programfilter programcode (optional, specify a program code. e.g. AP175. The default is all programs)
dbadmin set timestatsdir pathname (optional, ex. /home/username or C:\timestats. If not specified, stats files are created in /tmp or %TMPDIR% for Windows)
dbadmin set dataareafilter productline (optional, specify a productline name. The default is all productlines)
dbadmin set userfilter username (optional, the default is all users)
dbadmin set reuse off
#Clear the active database drivers so that the changes become effective
dbadmin idleall
tmcontrol -rp productline programcode (For online programs only)
#Run ‘dbadmin get’ after setting the options to check that the desired options are enabled.
#After should look like this:
Current Value for REUSE=OFF
Current Value for DEBUG=OFF
Current Value for DBAPIERRORS=ON
Current Value for TIMESTATS=ON
Current Value for USERFILTER=
Current Value for PROGRAMFILTER=HR211
Current Value for DATAREAFILTER=test
Current Value for TIMESTATSDIR=d:\lawson\temp\
Current Value for IDLETIME=1
Now you’re ready to submit your job again. Once the job is submitted, you should be able to see the stat files get created in the timestatsdir directory.
Wait until the job has completed before viewing the file(s).
You can view the files after the job is complete but they aren’t all that easy to understand. To make them easier to digest:
Go to the stats directory and run:
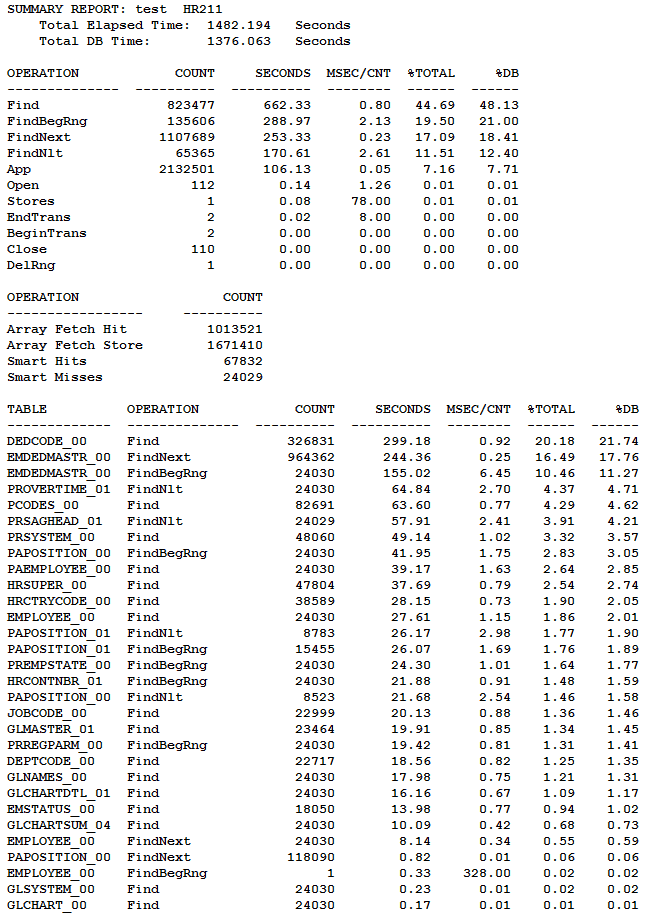
analyze_stats -o > stats.out
You’ll notice that you now have two new files in this directory.
stats.out and a cfg file.
The stats.out file will give you a really great view of what’s going on with your program while the cfg file can be place in the xxsrc directory of your code and compiled with the program to optimize it based on the timestats results.
After you’re done:
To turn disable timestats and re-enable driver re-use:
dbadmin set timestats off
dbadmin set reuse on